
Patterns in Global Volcanic Activity, Presented by Dr. Ben Andrews
by Andy Thompson, MSDC Secretary
This report is provided to encourage readers to visit MSDC’s YouTube channel to view the fascinating video of Dr. Ben Andrews’ presentation (about 43 minutes) and a follow-up question and answer session. Go to: Patterns in Global Volcanic Activity - Dr. Ben Andrews - YouTube
Introduction and Overview of the Presentation
Dr. Ben Andrews, Director of the Smithsonian’s Global Volcanism Program (GVP), began his evening presentation by stating that he planned to address two topics:
(1) What is the Global Volcanism Program (GVP)?
(2) A short overview of the 2018 Kilauea LERZ eruption, the most intensely researched volcanic eruption in history.
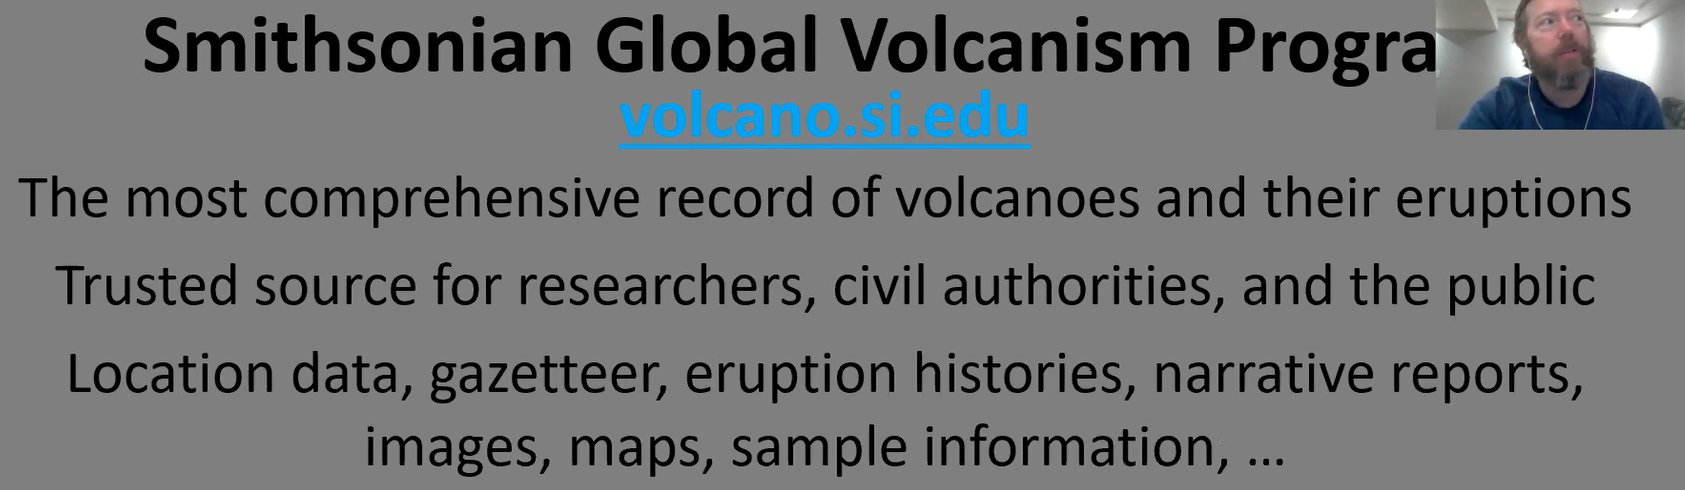
He began with an overview of the GVP, the most extensive resource of information on the world’s volcanoes. He noted that the database is free to researchers and the public alike and can be found on the Smithsonian’s web site: volcano.si.edu.
Dr. Andrews expressed his hope that his listeners were already somewhat familiar with the GVP and that his audience had used its information. He stated his intention to give a short update on the extensive resources which the GVP makes available online for scientists, mineral collectors, and the general public.
For the second part of his presentation, he planned to focus on what has been learned from the Kilauea eruption in 2018. For that, he said he would be drawing on the extraordinary findings made by researchers at the United States Geological Survey (USGS). He expressed his deep appreciation for the research and insights of his USGS colleagues.
Part One: What is the Global Volcanism Program
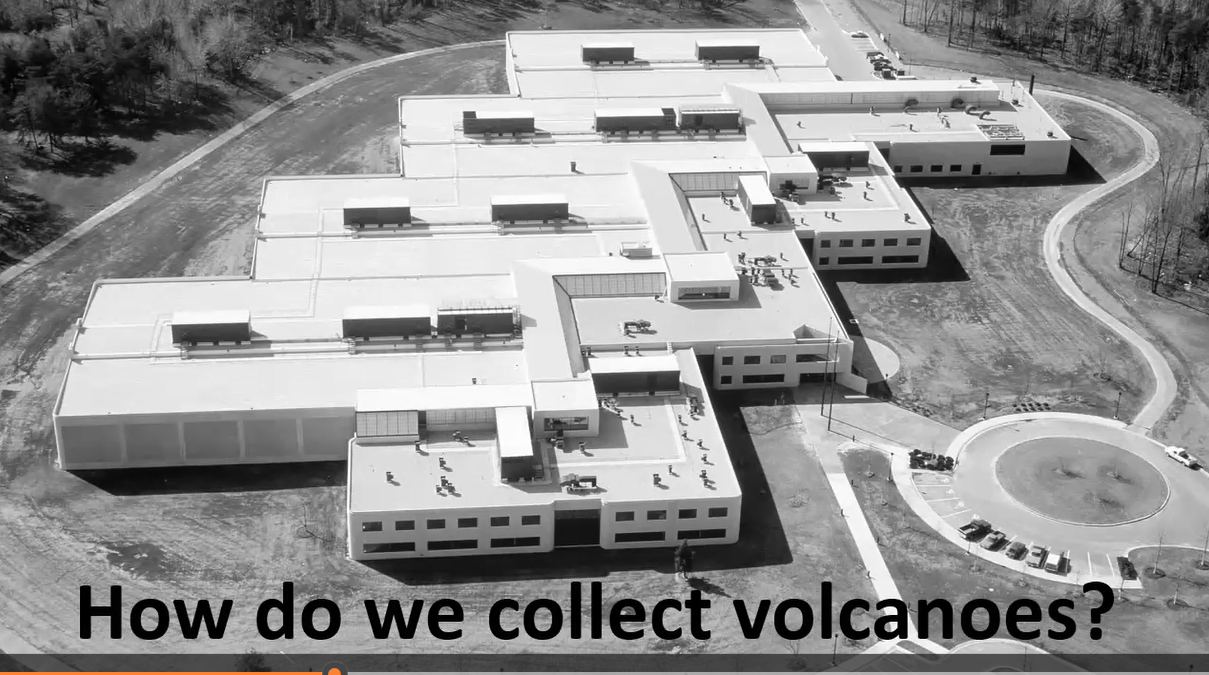
“Museums are all about collecting things,” Ben noted, “So how do we at the Smithsonian collect volcanoes?” Given their huge size, Ben said, no volcano could fit into any of the four football sized buildings that house the Smithsonian’s collectibles objects. But what this complex does collect and maintain are the data about volcanoes, as well as space for research on volcanoes and pyroclastic flows.
The data pertinent to each of the world’s volcanoes is categorized in the GVP according to the following variables:
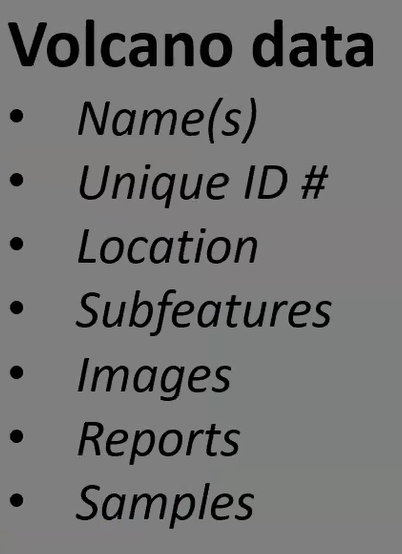
Ben said that just as each of us has a photo I.D. or driver’s license with our names, unique I.D. data and our physical features, researchers also provide this information for each volcano. The data include its physical characteristics and that of its immediate surroundings, including “subfeatures” such as vents, which are specified and photographed. Additionally, the data bank contains historical reports and mineral samples of these volcanoes.
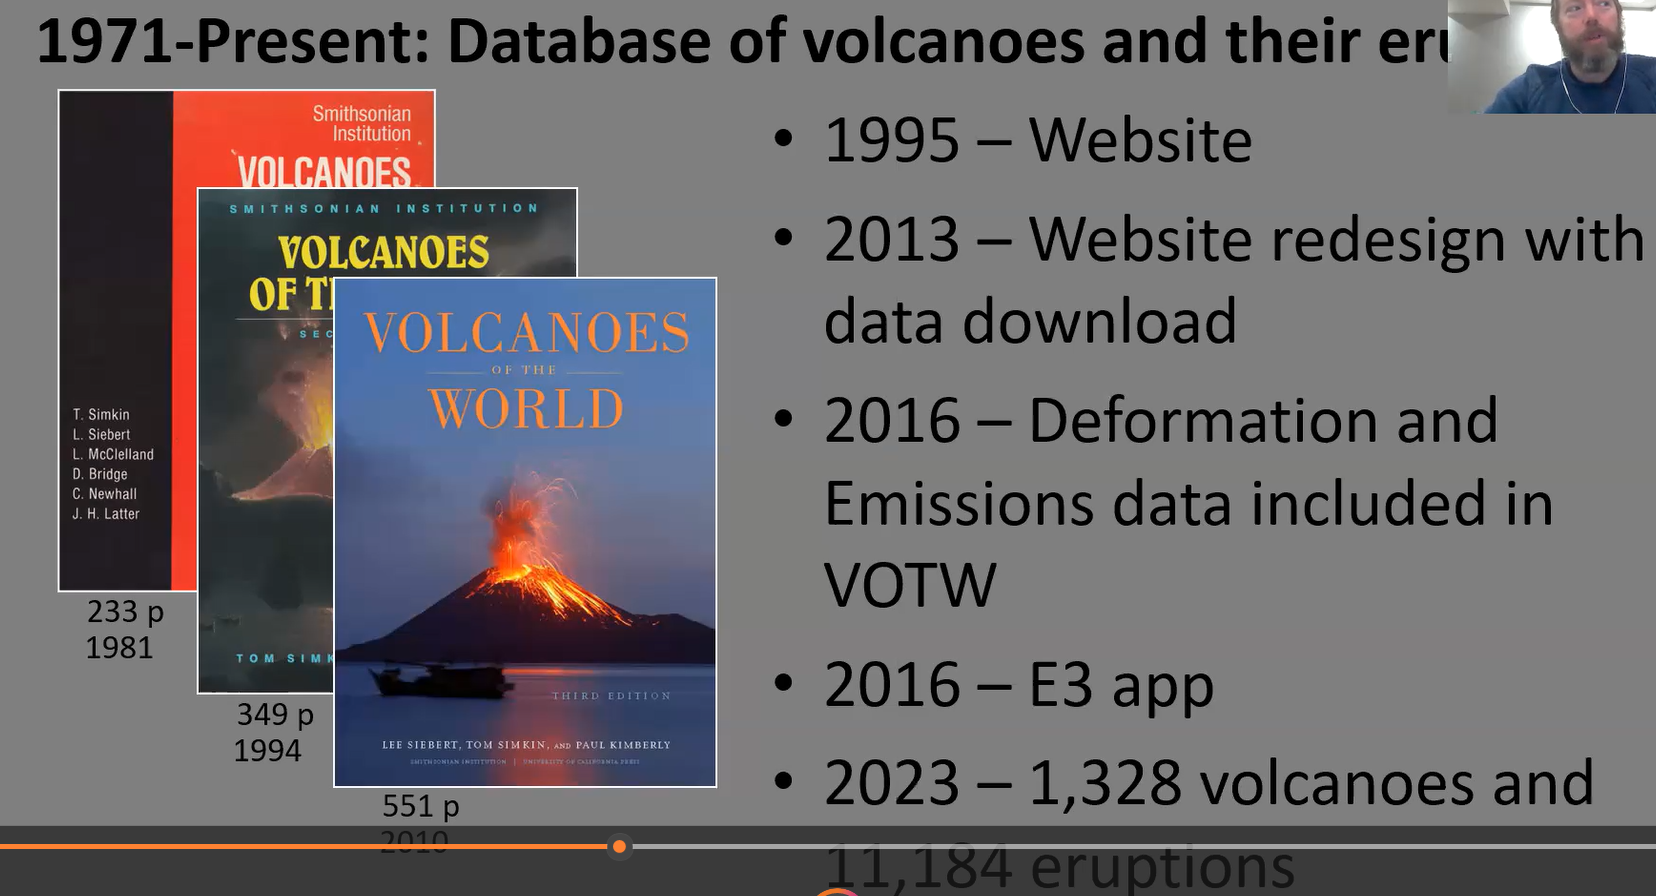
Importantly, the Smithsonian GVP’s approach to collecting and sharing its data has evolved over the last four decades. In 1981, the program produced an encyclopedic, hard-copy, book of 233 pages. By 2010 the work expanded into a Volcanoes of the World publication of 551 pages.
Over the following years the GVP not only increased the amount and type of volcano-related data published in its 2010 book, but by 2013, the Smithsonian scientists were able to make their data available for downloading from the web. Previously, this information had been available only in massive books.
By 2016 the GVP expanded the available data to include for each volcano of the world (VOTW) all its available “deformation and emissions data.” And this year, 2023, the web site now includes data for each of the world’s 1,328 volcanoes and updates on their 11,184 eruptions.
The above bulky books are no longer being published because today, all this information is now digital and more widely available. Ben suggested we simply go to Volcano.si.edu and click on the appropriate tabs: “reports, database, learn, question, info and contacts.” Here, below, is what you will see on line.
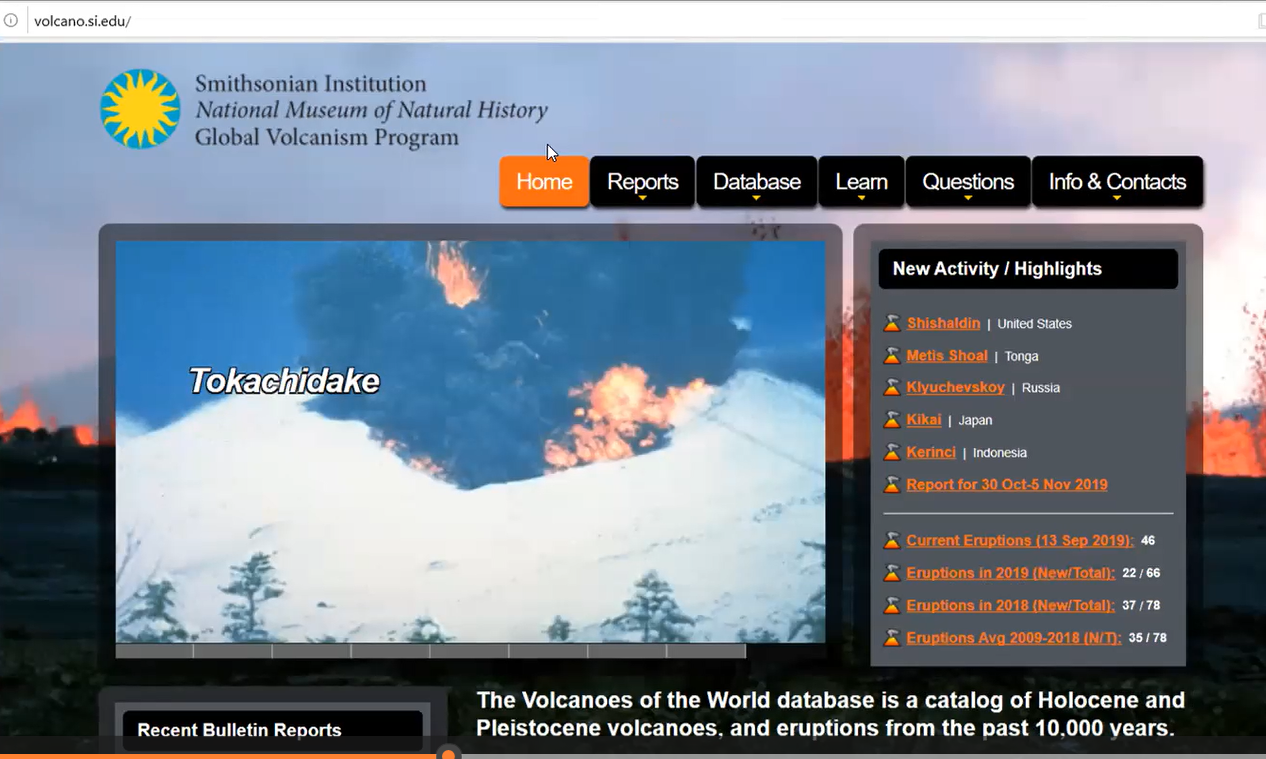
Ben encouraged everyone to visit and review the profiles of the volcanoes with the possibility of finding their favorite volcano. He likened these volcano profiles to Facebook profiles with which so many are already familiar. The Smithsonian, Ben added, was providing these profiles before Facebook existed and underscored that the Smithsonian site is very user friendly.
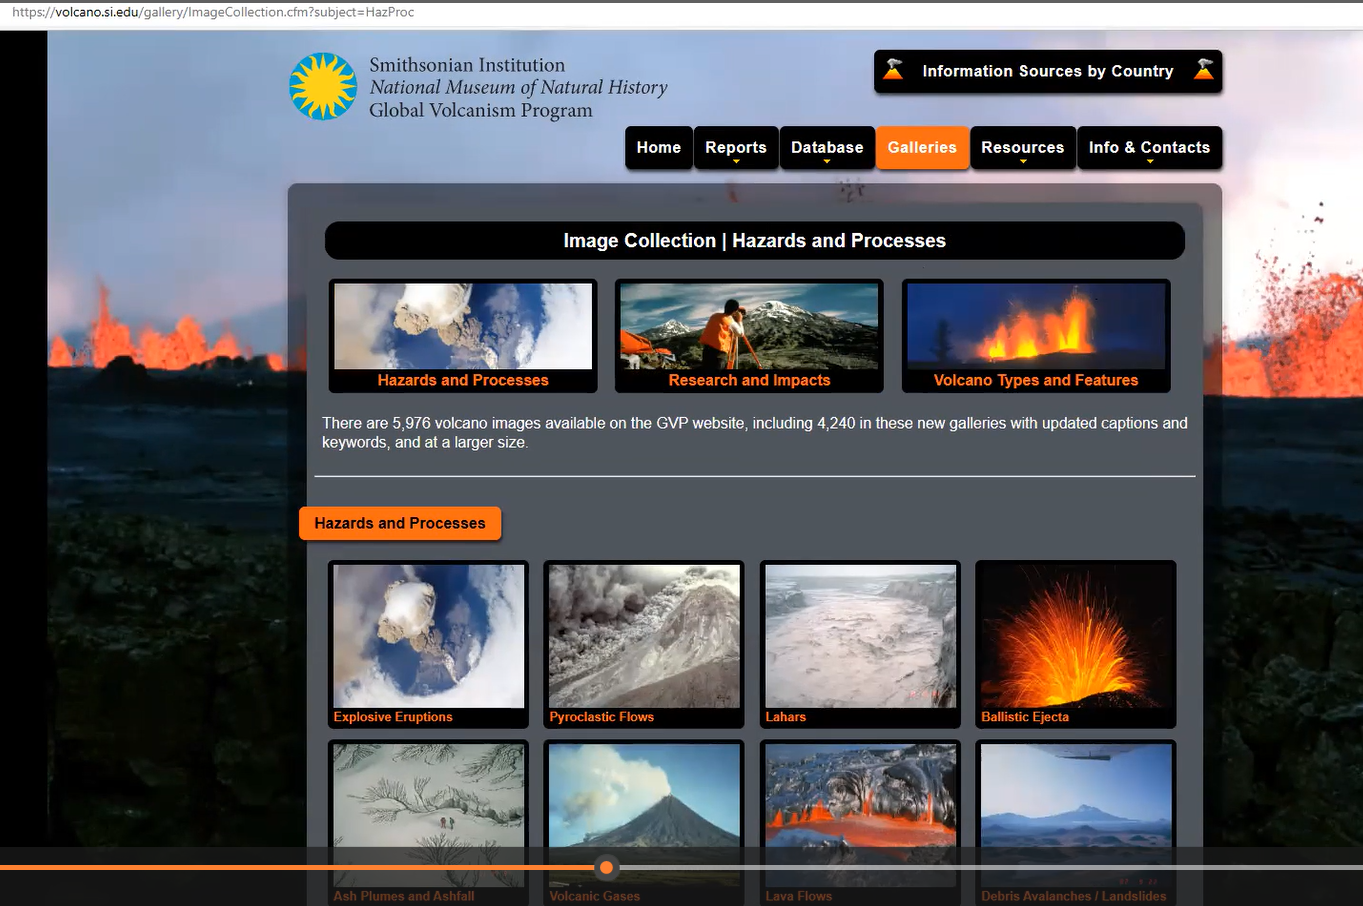
A case in point shows how easy it is for visitors to make their way to the “Galleries” tab, highlighted below in orange, which gives access to a vast number of exciting and interesting videos.
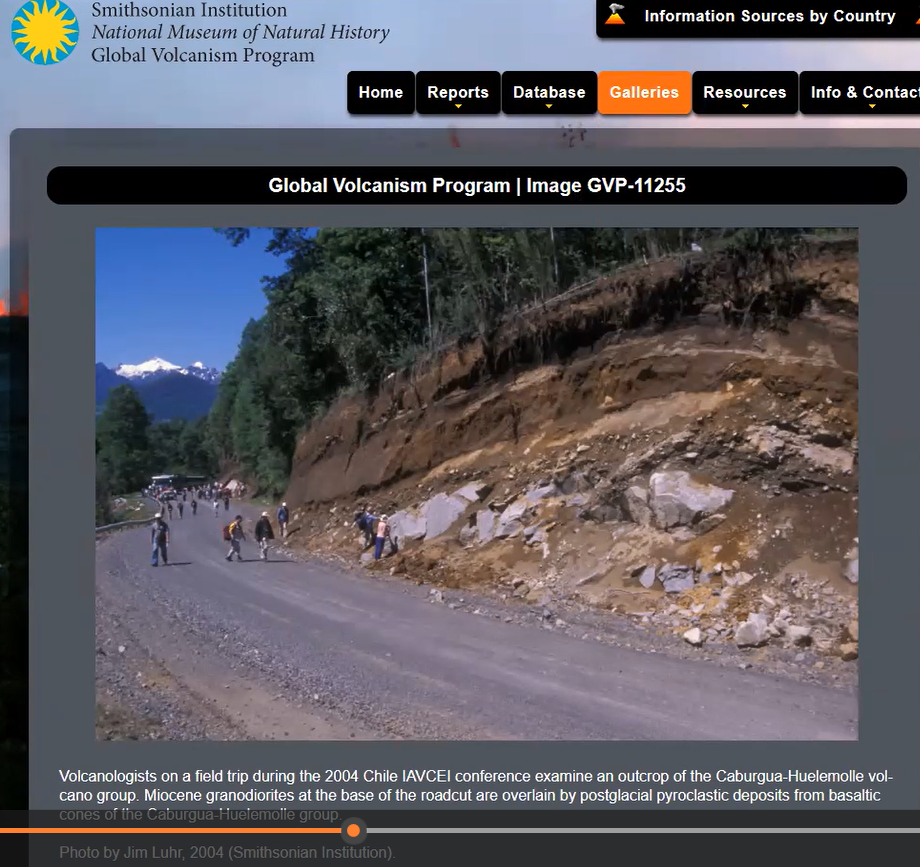
Beside the videos, the Galleries tab opens the door and gives access to hundreds of photos based on diverse categories which can appeal to the specific interests of visitors. The photo below, for example, shows volcanologists in 2004 visiting a road cut outcrop of the Caburgua-Huelemolle volcano group in Chile and provides insights about the geology.
There are also historical maps which are not available on Google because they predate Google.
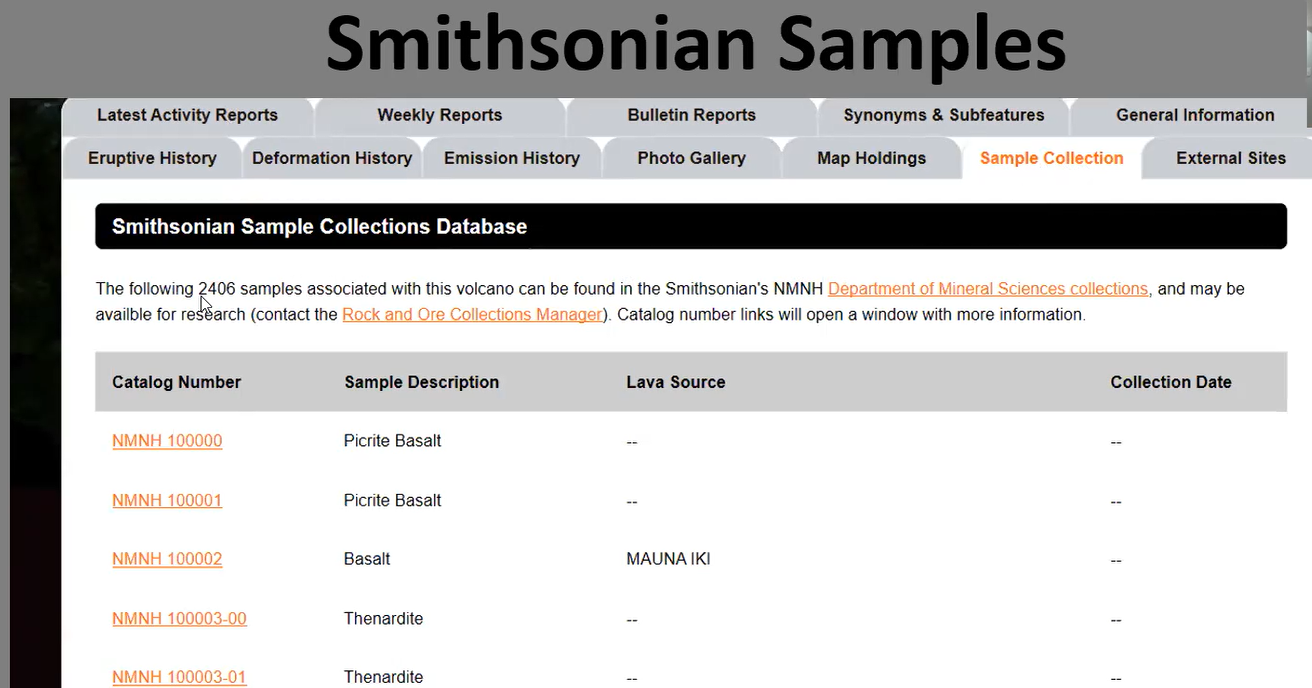
For mineral collectors who want to dig into volcanic specimens that are actually held in the Smithsonian's collection, viewers can go to the site below and pull up photos and information on each of the catalogued specimens that have been collected from across the globe.
The GVP website also contains an extensive collection of its published monthly and weekly bulletins, occasional reports, and eruption histories of specific volcanoes.
Ben then asked the question: "What good is all this data? For example, do we know if volcanic activity is growing or decreasing over time?"
For the answer to this important question, we encourage you, the reader, to view Ben’s presentation in its entirety. Here is a hint: be careful about information bias and be aware that the use of satellites has increased our ability to accurately monitor what is happening everywhere on our planet.
As part of his conclusion to Part 1, Ben summarized the value and importance of the Smithsonian’s Global Volcanism Program with the following slide.
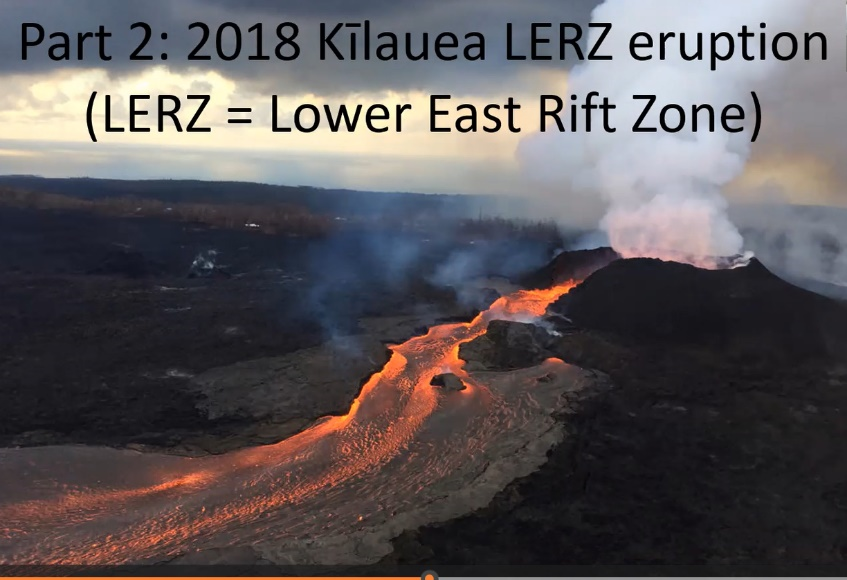
Part 2: A Short Overview of the 2018 Kilauea LERZ Eruption
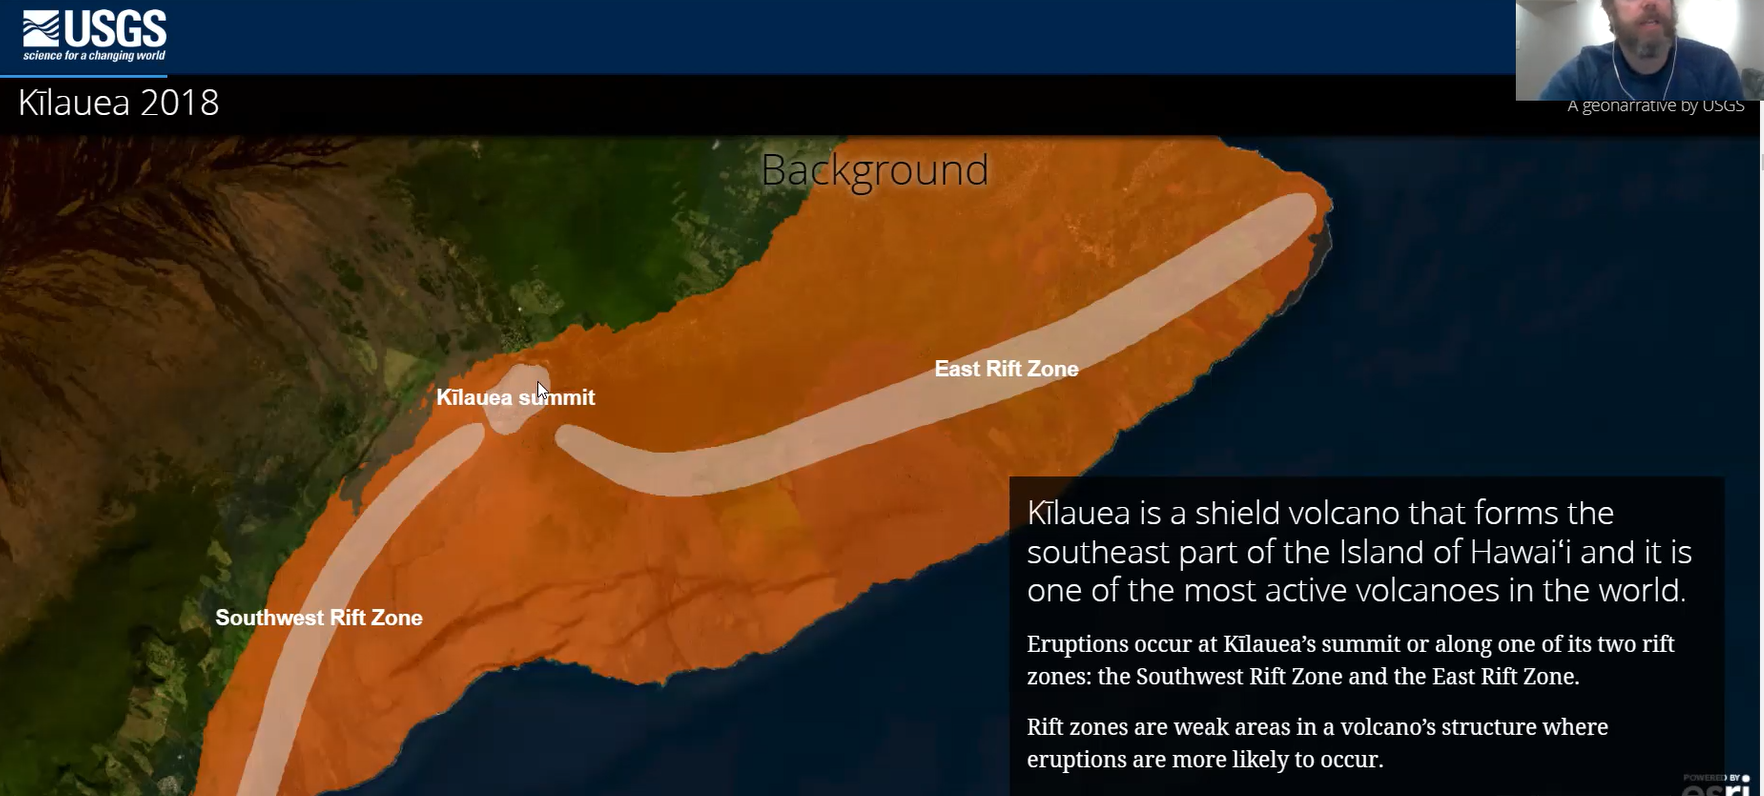
Of all the world’s volcanoes to focus on in the second half of his presentation, Dr. Ben Andrews chose the relatively recent Kilauea volcano and, specifically, two aspects of its dynamics.
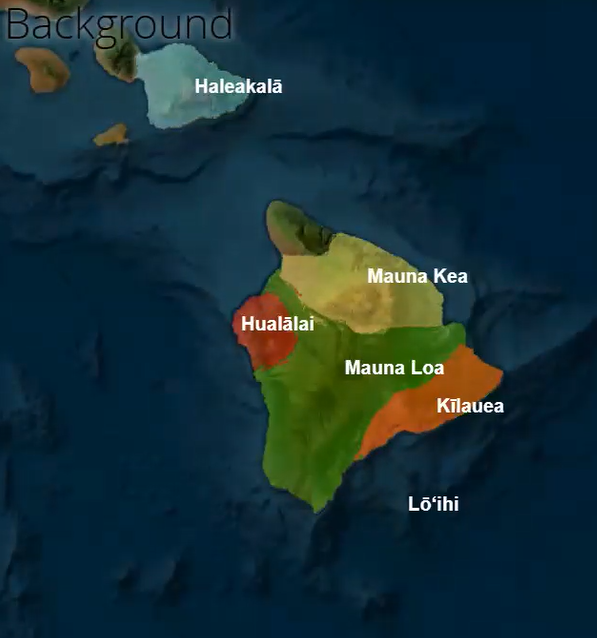
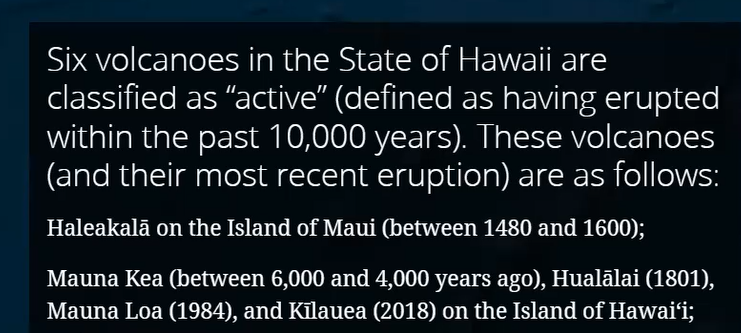
To provide a geographic and geological context, he noted that the State of Hawaii, with its principal recent volcanoes illustrated below, has been the world’s most active site for volcanic activity.
Ben chose Kilauea and its 2018 eruption to discuss in part because it has been the most extensively researched event in the history of volcanology. This is not only because of the eruption’s size but also of its duration. In his own words, he highlighted its importance and noted, in particular, the extensive data collected by scientists at the The Hawaiian Volcano Observatory (HVO):
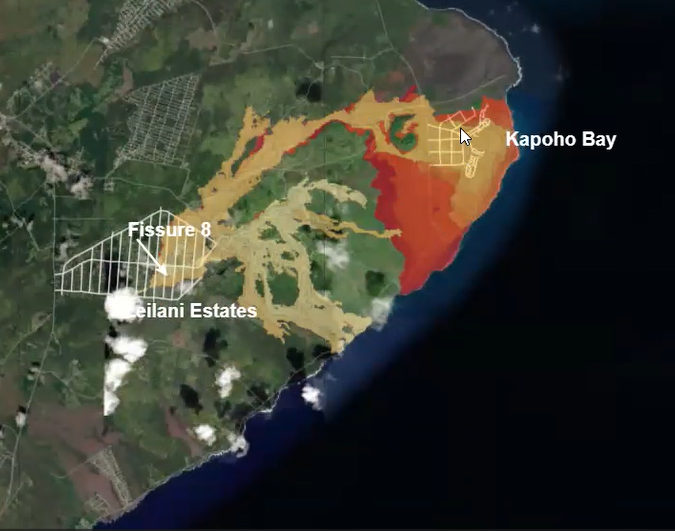
The 2018 eruption generated dozens of smaller lava flows from fissures, some of which had short life spans. But it was Fissure 8, pictured below, within the Lower East Rift Zone (LERZ), which had the longest life span and has had a significant destructive impact on Hawaii’s big island.
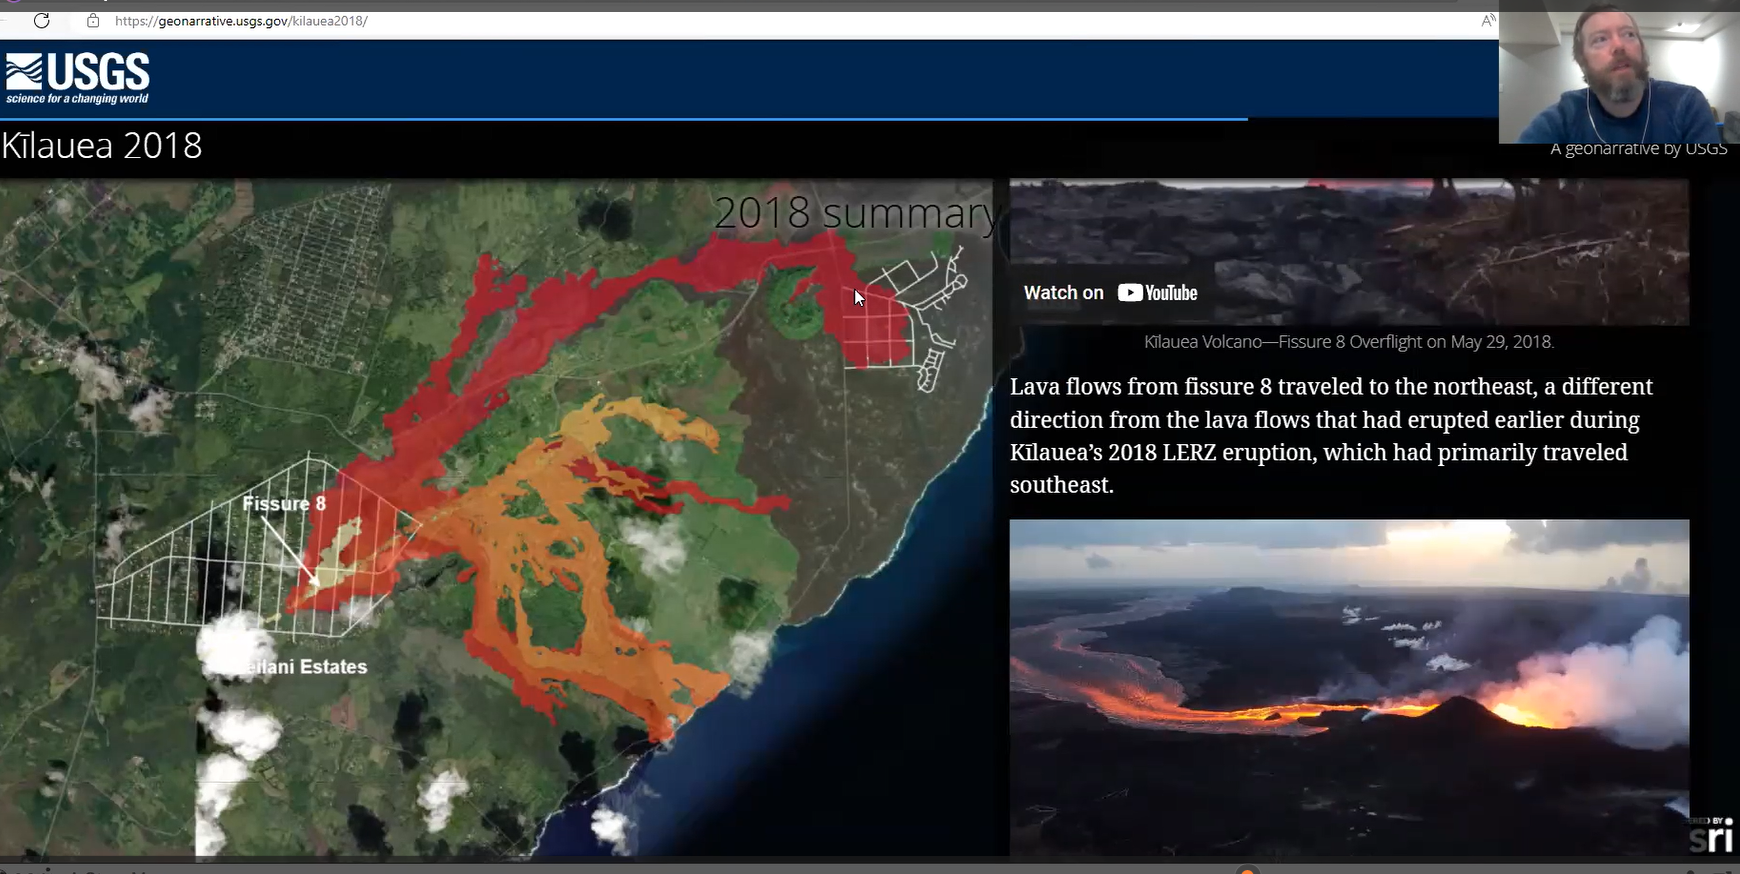
The above image distinguishes between the two Fissure 8 lava flows, with the orange occurring earlier in 2018 and the red coming later with greater velocity, heat and duration. This provided USGS researchers the opportunity to collect extensive data never before available to the volcanology research community.
At practically the same time Fissure 8 was gaining strength and pushing farther north and east, the expansive caldera floor within the summit of Kilauea was gradually dropping. The photo on the left shows the depression at the summit (1,200 meters) having a flat caldera floor in April of 2018. By August, that floor had caved in and dropped about 600 meters which is more than the height of the Empire State Building (380 meters).
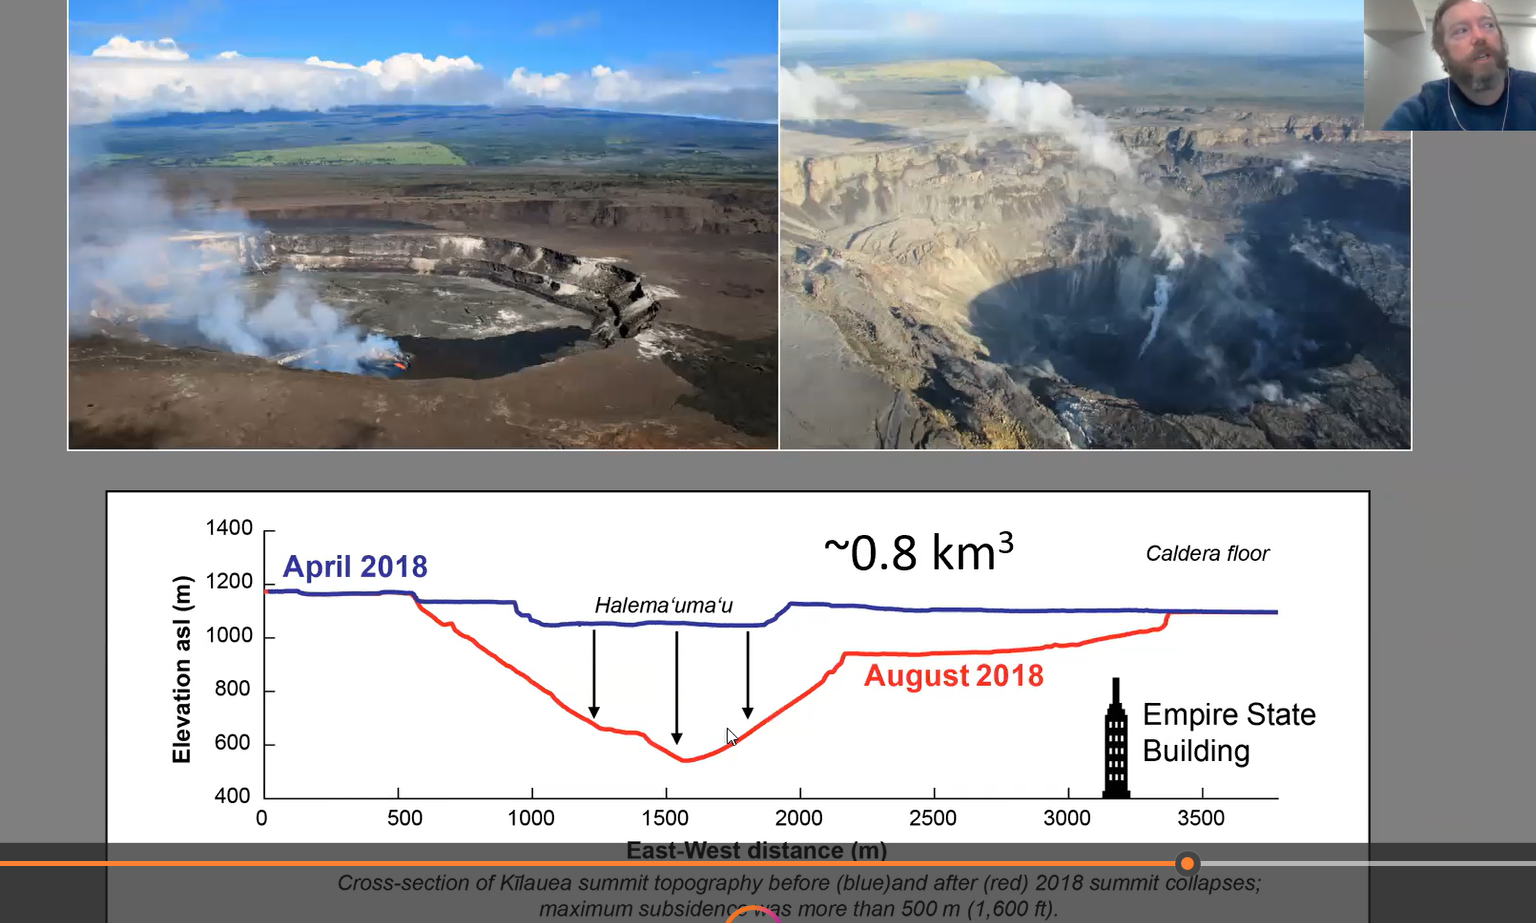
The relationship between these two major events -- the dropping of the caldera floor and the increasing of the lava flow though the fissures -- is complex. The way to think about their interaction, Ben suggested, is that as the lava exited via the fissures which decreased the volume of lava in the pool beneath the caldera floor which, in turn, resulted in its dropping as shown in the cross-section above.
Again, the purpose of this report is to encourage readers to view Ben’s entire presentation which is found at: Patterns in Global Volcanic Activity - Dr. Ben Andrews - YouTube.
Viewing the video will help everyone gain a fuller understanding of Kilauea’s dynamics and learn, week by week, how the lava from Fissure 8 progressed through the Pu’u O’o vent, cracking roads, destroying homes, encountering andesite at Fissure 17 rather than typical basalt minerals, and eventually making it to and creating new land in a portion of Kapoho Bay.
Conclusion
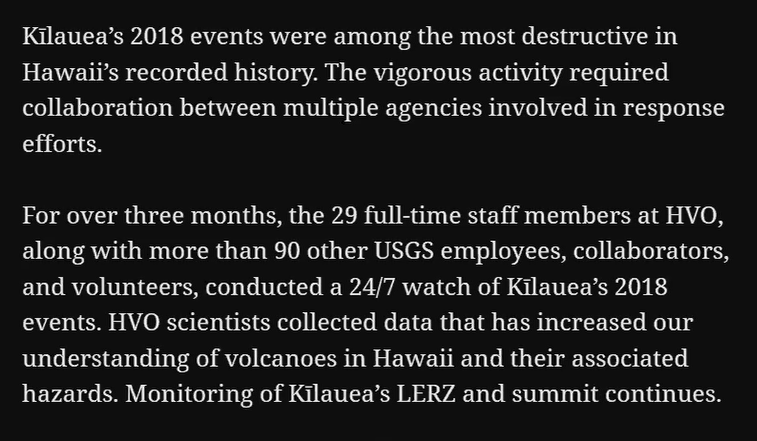
Dr. Ben Andrews described the final months of the 2018 Kilauea eruption, May through July, and how the USGS monitoring system tracked lava and allowed authorities to save residents’ lives, but not their roads or properties.
By July, USGS’ 30 staff members tracked the frequent periodic earthquakes as the lava dome collapsed and sent high pressure streams of lava northeast toward the community on the Bay. In all, Ben reported, the USGS had cycled 90 staff members onto the big island to monitor this extraordinary volcanic event thereby providing research findings for volcanologists throughout the world.
President Kenny Reynolds and VP Cindy Schmidtlein thanked Ben for his extraordinary program. They then opened the floor for discussion and questions which addressed whether humans contribute to earthquakes, the impact of melting ice sheets, the recent earthquakes in Turkey, the chemistry of what happens when lava meets ocean water and additional queries from his enthusiastic audience.
At the end of the evening, his Zoom audience signaled their appreciation with applause.
His entire presentation, along with Q and A, are found at: Patterns in Global Volcanic Activity - Dr. Ben Andrews - YouTube